Models (14–16): Osmosis
Osmosis
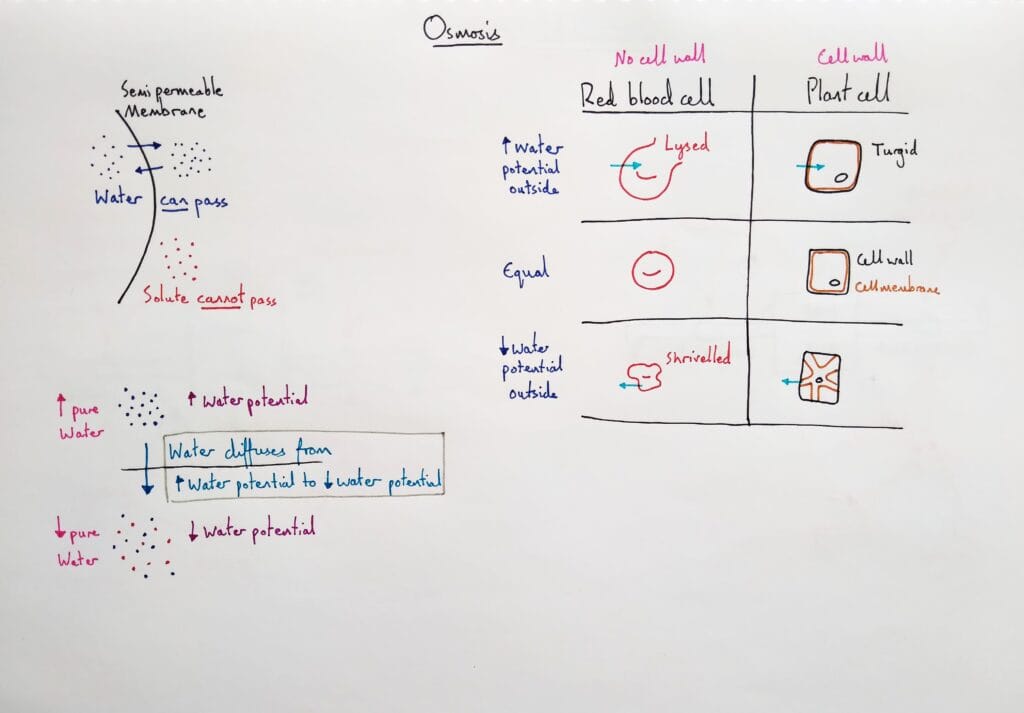
Given the choice, I’ll always choose water potential over tonicity. Water potential follows the same pattern students learn in other concepts, such as diffusion: water moves from high to low. When talking tonicity, however, water moves from hypotonic (low) to hypertonic (high) solutions. Plus, my students find it easy to remember that water potential is like “water purity”. I don’t discuss why osmosis occurs, that’s way too far for this age. But if you’re interested, I write about it here.
Osmosis in a graph
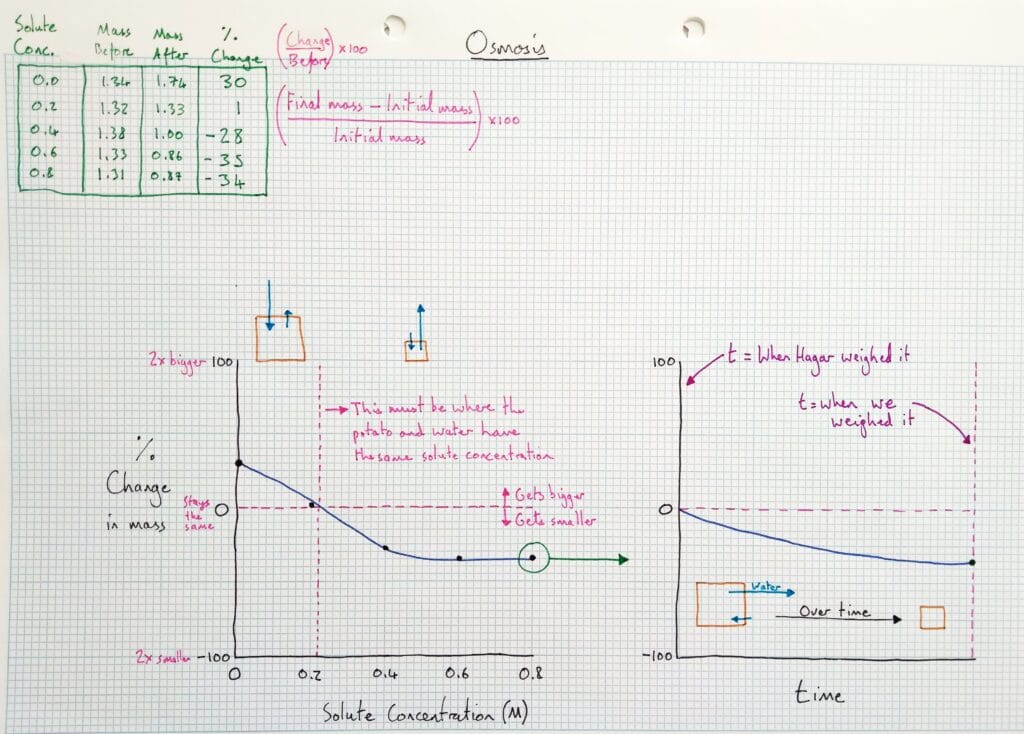
We carry out the typical experiment of leaving vegetables in solutions of varied solute concentration. Then it’s time to graph the results. The biggest obstacle for students is often hidden; many struggle because they see the graph as a time graph. The solution is to draw a time graph and distinguish them. As I explain in Teaching Meaning, variation (in this case, the different graph types) is the key move to prompt students to understand. As in every lesson, each section of the graph needs to be co-constructed, step by step, with students.
How osmosis differs to diffusion, active transport, and osmosis
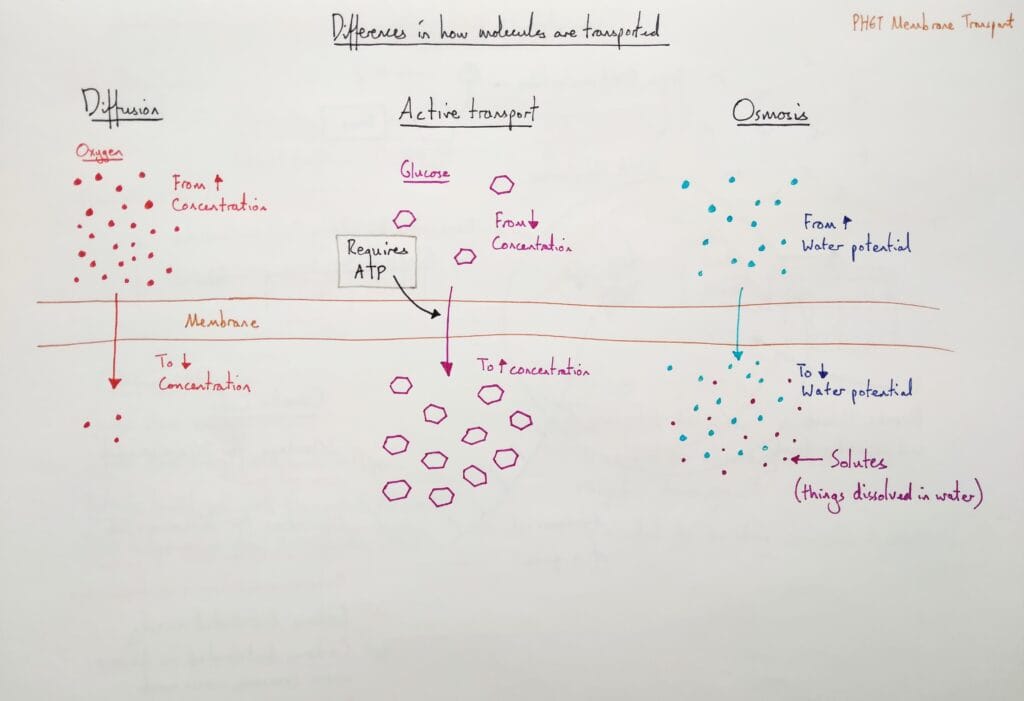
This lesson involves the use of the fantastic membrane transport PHET simulation, and the key teaching move of variation (see Teaching Meaning).