How I teach the lac operon
The lac operon is a classic of genetics and is common in biology curricula. Yet, students can sometimes find it difficult. I want to show you how I’ve taught it using a stock and flow model.
I began by discussing the structure of the lac operon. This lesson came after several in which we’d considered the complexity of eukaryotic genomes. This included introns and vast regions of “non-coding” DNA. Yet bacterial DNA has evolved to be streamlined. I drew the diagram below to show how the genes are positioned.
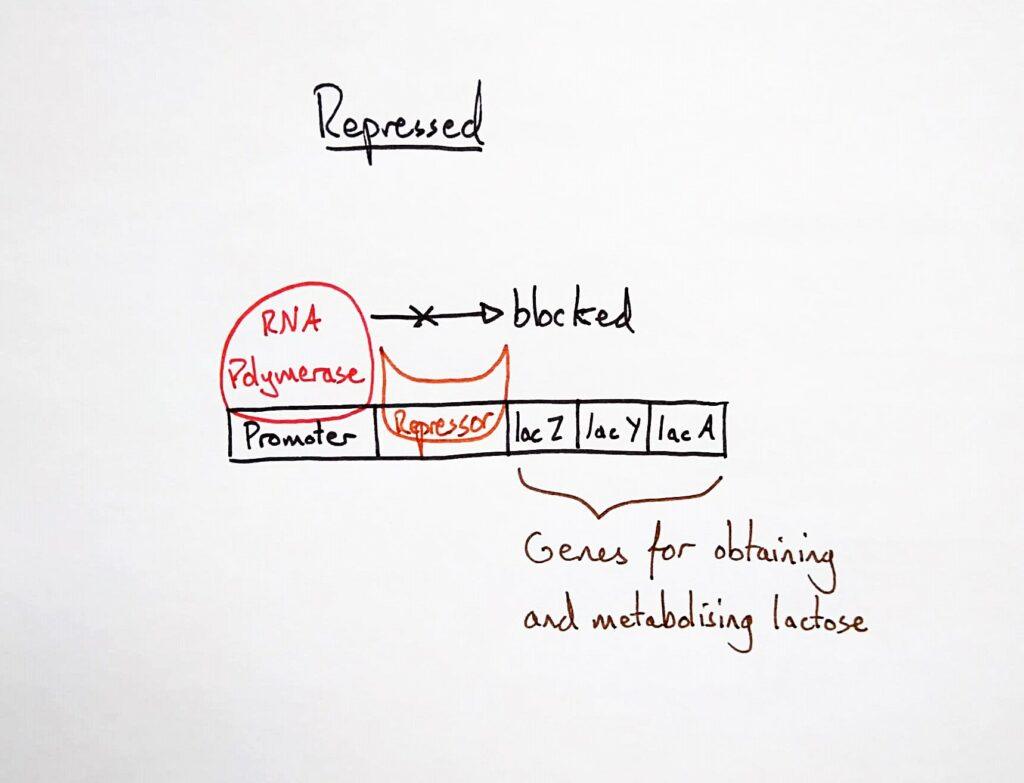
Bacteria have different pressures than eukaryotes. When their genomes become too large, their reproduction rate decreases as they take too long to replicate their DNA. Here we see three genes, shoulder to shoulder, under the regulation of a single promoter.
To teach the meaning of this I had to vary this idea, so students could see the difference it makes.
I contrasted it with a hypothetical genome in which each gene were isolated and controlled by its own promoters. The genome would be larger, and coordination would be tougher.
The lac operon is organised efficiently: it has a single promoter to synthesise three proteins as a package for a single function: obtaining and metabolising lactose.
Efficiency is key for the bacteria in more ways. I explained to my students that a bacterial population that continually produced these proteins, even when no lactose were present, would be wasting precious resources that could be used elsewhere. A system must regulate the gene expression so that it is expressed only when needed.
I introduced them to the repressor in the diagram above and then drew the next:
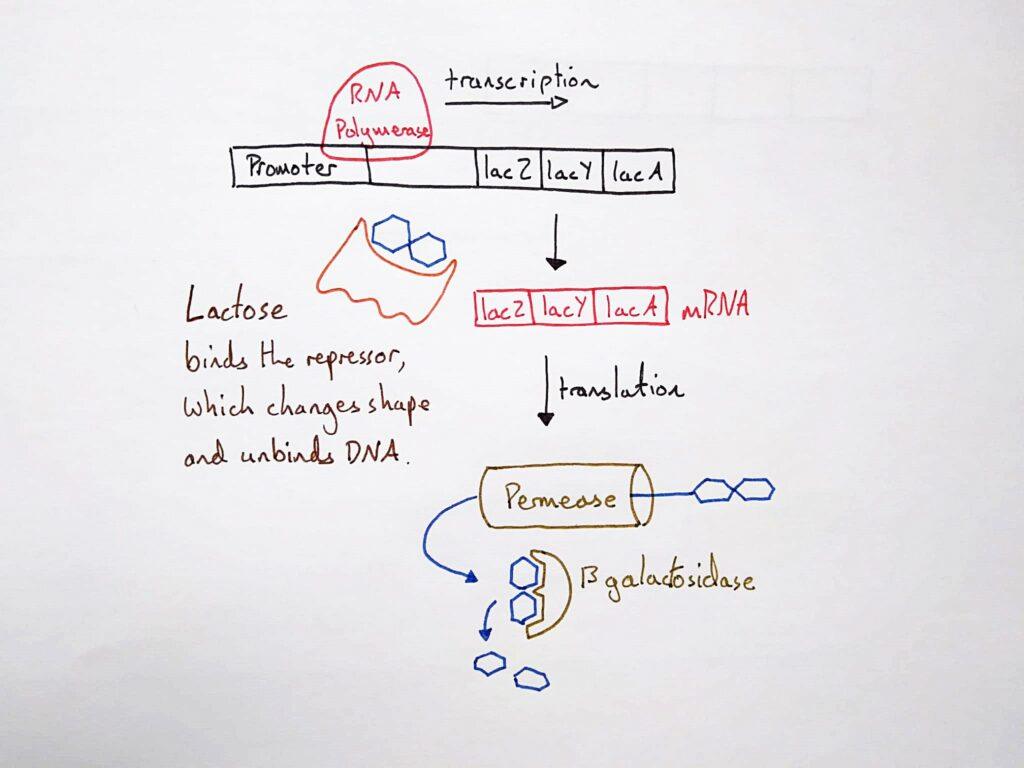
Now I explained the basics of the lac operon. Lactose binds to the repressor, which changes shape to lose its affinity to DNA. RNA polymerase is then free to transcribe a single mRNA yielding three proteins. I told the students we’d only focus on two: the membrane pump (permease) and the enzyme (beta-galactosidase).
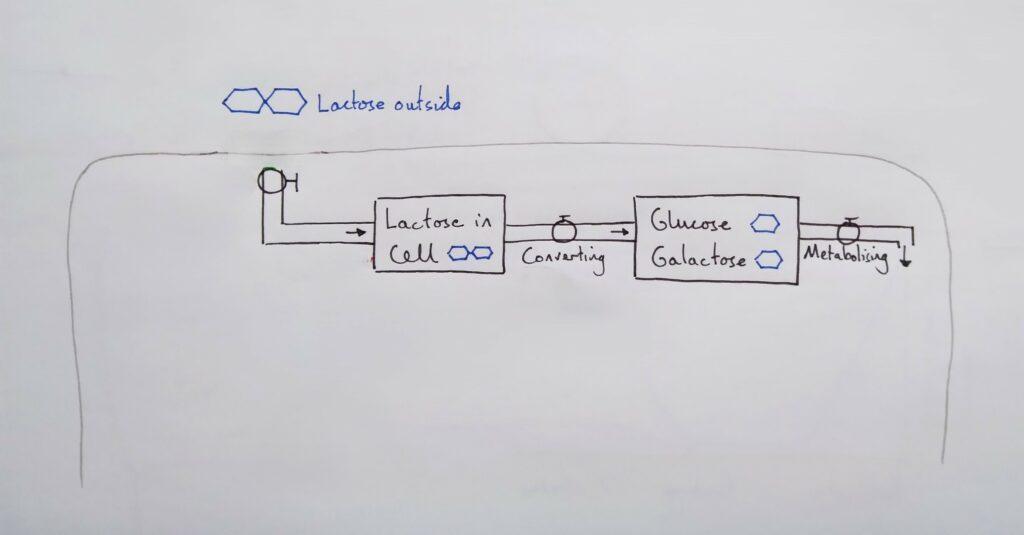
With these two diagrams, the students could see the varying conditions of the system: repressed or activated. But, they also needed to consider the system dynamics over time. This is where I introduced a stock and flow model. I began by drawing the cell with the stocks and flows inside.
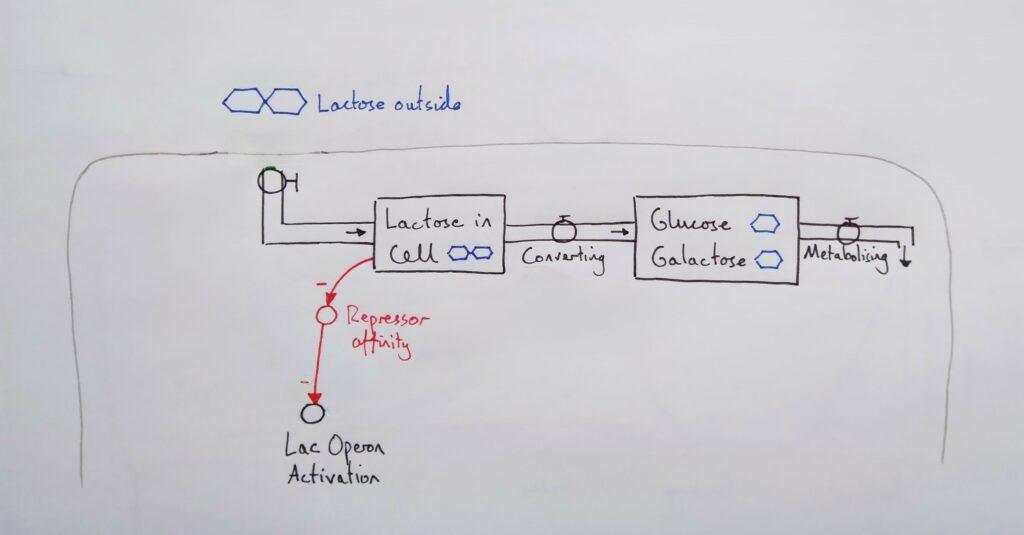
For the next step, I asked the students what regulated the transcription of the operon. By looking back at the operon diagrams, they answered that the repressor did. I added this variable to the diagram (below): repressor → operon.
I asked the students whether this connection was “same” or opposite”.
“Same” ⊕ means: ↑X, ↑Y; or ↓X, ↓Y, (so activated repressor → activated operon)
“Opposite” ⊝ means: ↑X, ↓Y; or ↓X, ↑Y, (so activated repressor → repressed operon)
I gave them some time to think, and then they voted. They agreed that it should be “opposite” ⊝. In other words, the higher the repressor’s affinity (for binding DNA), the lower the transcription rate of the operon.
And so what regulated the repressor? They agreed that it was the presence of lactose. I added the connection from the lactose stock to the repressor and asked them again to vote whether it was “same” or “opposite”.
Now we had sufficient variables in the model to consider some dynamics.
I told the students there was lactose in the cell. If we follow the connections, what would happen? I let the students trace their fingers over the model and think, and then asked for answers.
Of course, the lactose would inhibit the repressor. Then transcription would proceed, and lac operon mRNA would be translated into the proteins we’d already mentioned. I added these to the diagram:
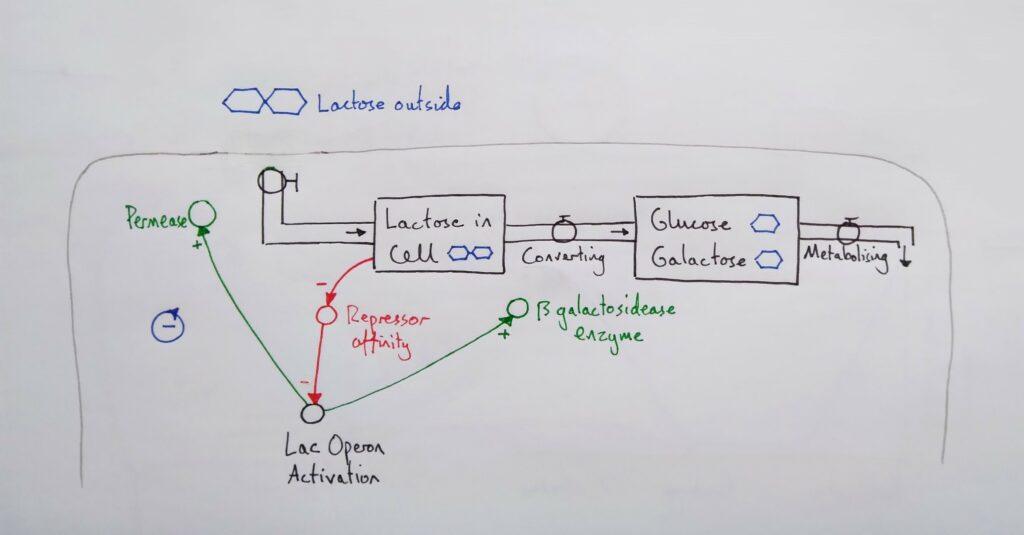
I focused next on the membrane pumps and added them to the diagram. I asked the students what the rate of “entering” would depend on. They suggested the number of pumps and the concentration of lactose molecules outside.
I added these two connections to the “entering” flow. Both have a “same” connection, because, for example, “the more lactose outside, the more will enter.” (sorry I forgot to draw the connection on this diagram).
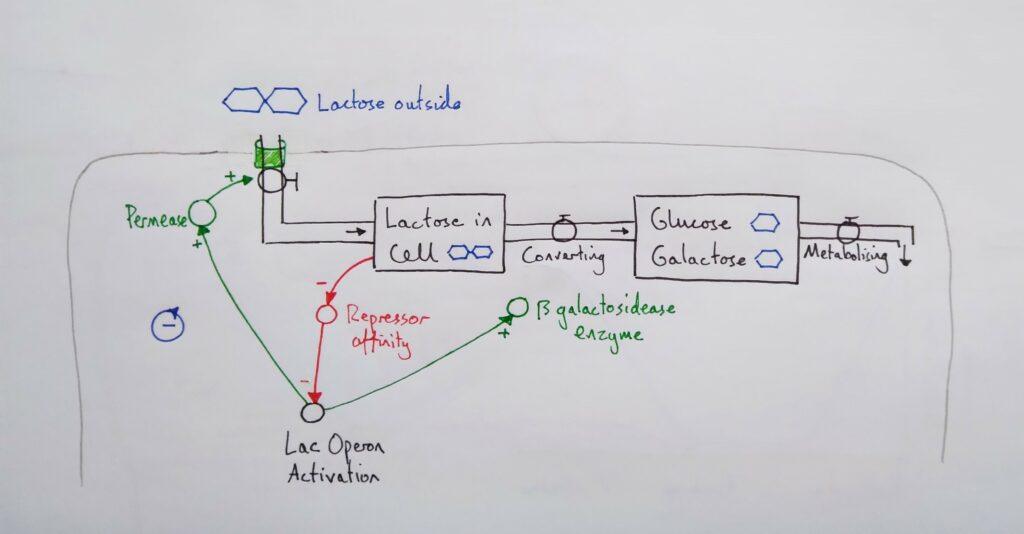
We then traced the lactose through the system (using fingertips always helps). Lactose would enter and accumulate in the cell. Then it would be converted into glucose and galactose. The focus now turned to the enzyme and we added the “same” connection to the “converting” flow.
The model was now complete, but there were still more dynamics to explore through variation. I asked the students what would happen if the lactose concentration outside started to diminish. Following the model over time, they agreed that the lactose inside the cell would decrease. This is because less would be entering the cell than being converted into glucose and galactose.
This would then cause the repressor to free itself from lactose and regain its binding-affinity for DNA. It would then shut down the expression of the operon. The system seemed to work, and the students appeared satisfied.
But, I asked them, what would happen if a new source of lactose were encountered?
The students fell for the trap. They began tracing the lactose through the system as if it could enter immediately. After some time, some students pulled faces as they realised something wasn’t quite right. If the operon was not expressed, there wouldn’t be any pumps in the membrane and, therefore, lactose couldn’t enter to inhibit the repressor.
Once they had noticed the problem, it was time to give my explanation. I pointed out that the variable had been named “repressor affinity”. I told them the affinity wasn’t “100%” but a bit less. This means that, just by chance and probability, the repressor would unbind spontaneously from time to time. This means that a very low level of the operon mRNA is generally always present, and, therefore, so are the pumps often present in the membrane.
To give this system meaning, I had to vary it and show a difference. I contrasted it to a hypothetical system that had to synthesise proteins to detect lactose and then somehow communicate this to the genome. This would likely have a higher energy cost.
Leaving it to chance, in this case, works well enough and is much cheaper. We finished the lesson with the students self-explaining the model. If you want to teach this way, read more in my books: