How I teach population size controls
Stock and flow models lend themselves to most concepts in biology, but population ecology is an iconic case, and a good place to begin. The model reflects Malthus’ original ideas, those that influenced Darwin. In this post, I’ll show you how I’ve taught this with a class of 14-year-olds. See how I initially introduce students to stock and flow models here.
What’s the model structure?
As with any model, I begin with the stocks and ask students what they think we should call the flows.
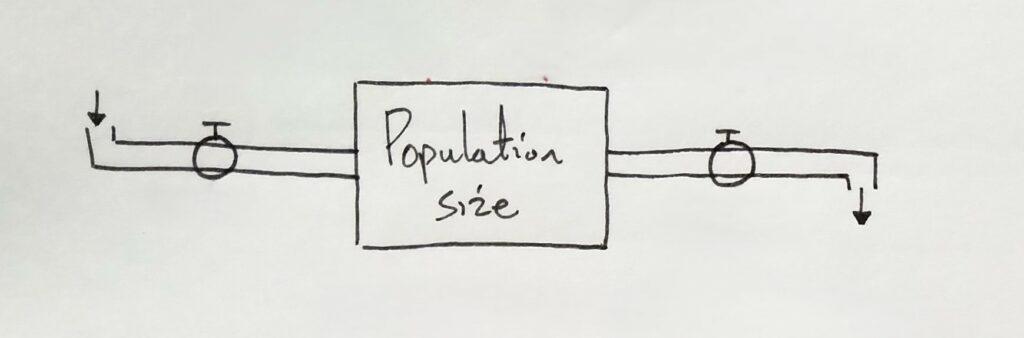
It’s important to remind students that what flows through a tube is what also accumulates in a stock. If water accumulates in a tub, then water must be flowing through the tubes.
If individuals are accumulating in a population, what must be flowing through the tubes? I put these questions to the class and ask them to name the flows. Students typically suggest many things at this point, including food, weather, disease, and predators. But none of these are the flows.
All those suggestions are factors that could be included in the model, but we need students to distinguish between what directly increases & decreases a population and what is an indirect factor.
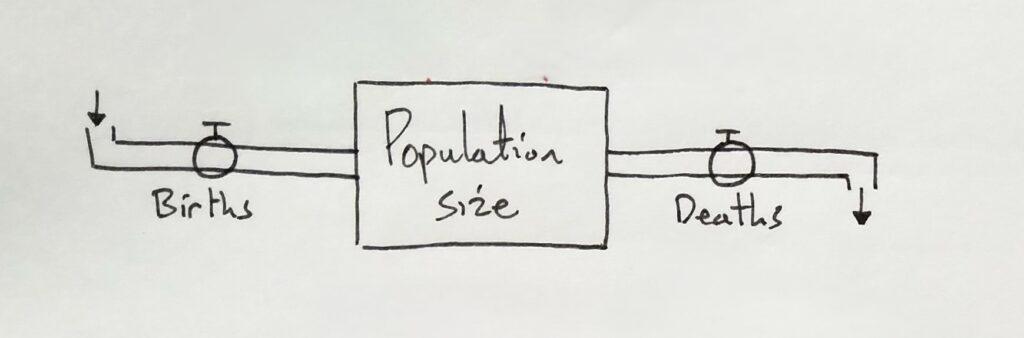
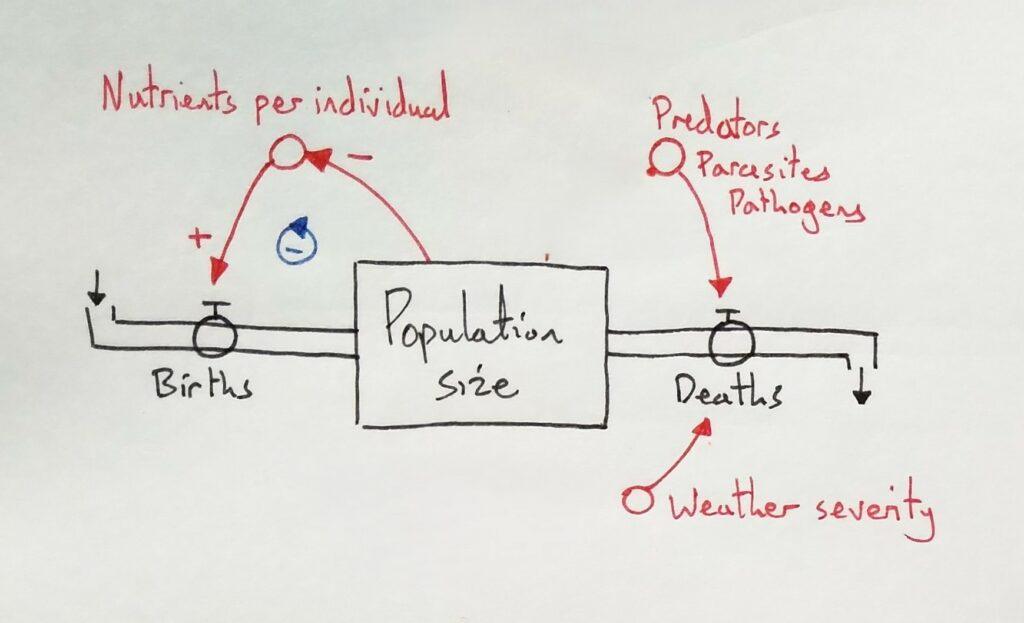
If individuals are in the stock, then the flows must be gaining and losing new individuals. In my simplified model (not including migration), the inflow, therefore, is “births” and the outflow is “deaths”.
What affects the flows?
Next, I’ll ask students to discuss in pairs the factors that affect the birth and death rates. When I collect their ideas, the most common answers are food availability, predator populations, and disease. With less frequency students suggest that weather is a factor, and the availability of mates (this latter point can be summarised as the population size itself is a factor).
What factors are included will determine the model. Once you’ve accepted a few responses from students, you can ask them how many factors are enough. Should we include everything we know? This is a great opportunity to remind students of the purpose of models—simplifying complex problems to make the mentally tractable.
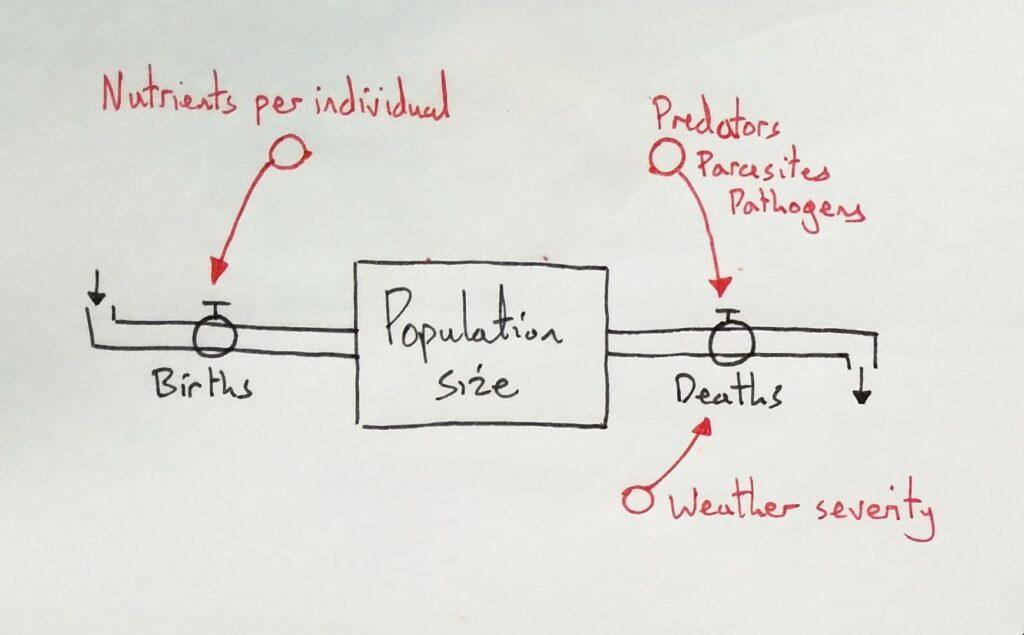
I typically settle on these. I’ll ask which flow each factor affects. They’re typically happy that predators and poor weather affect deaths directly, but the availability of nutrients is harder. In starving, it affects deaths, but I tell students that I’ll leave this off the model so we can focus on something else: available nutrients affect the birth rate.
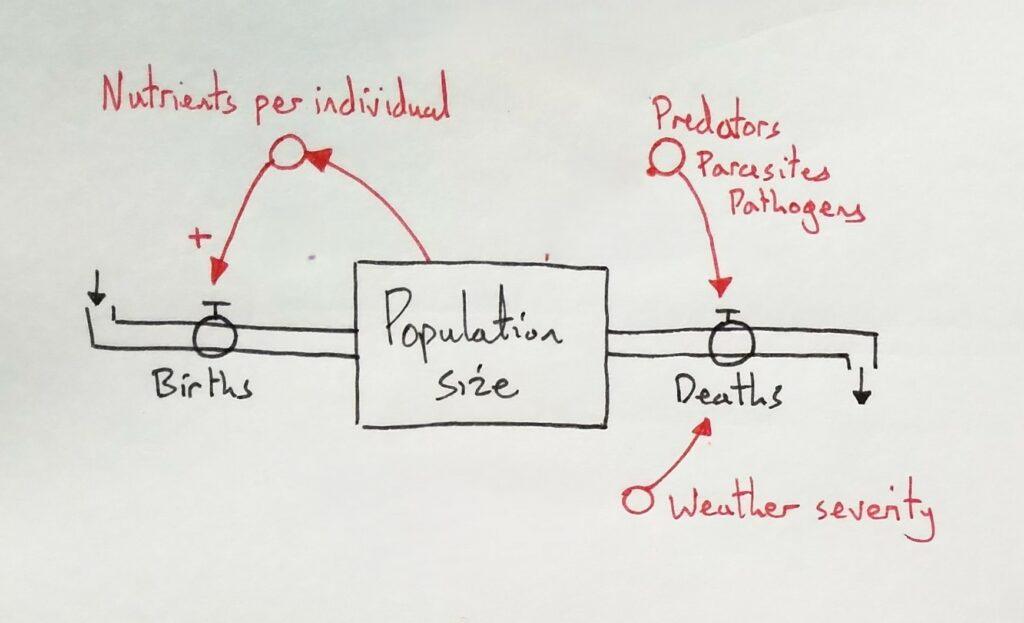
How does it affect the birth rate? A big problem in science education is the word “affect” because it doesn’t tell is the direction of the interaction. Do more nutrients increase or decrease the birth rate?
There are particular symbols to represent the two directions:
“Same” ⊕ means: ↑X, ↑Y; or ↓X, ↓Y, (so more nutrients → more births)
“Opposite” ⊝ means: ↑X, ↓Y; or ↓X, ↑Y, (so more available nutrients → less births)
Which makes sense? I have students vote on nearly all these decisions. This is how the make the model theirs, rather than mine. I point to the arrow connecting nutrients to births and ask the class whether its “same” or “opposite”. They can chat in pairs for a moment, then they vote by raising their hands.
Aside from getting students to make sense of the model, this allows me to see what the class thinks. With the information I can decide what to do next.
My students always feel that more nutrients → more births makes sense. But a “same” ⊕ has two explanations. It also means less nutrients → less births. I ask the students is this makes sense, and, often, they’re not sure. Examples help: If a wolf has little nutrients to eat, do you think it’d have less pups than normal? This makes sense, but does it make sense for humans? Yes, I tell them, when humans are running low on nutrients, their menstrual cycle stops, only to return when the nutrient flow increases again.
What causes what?
The next question is what affects the available nutrients. Many things could in specific situations, but this is a general model. I let students discuss this in pairs, and typically some will suggest that the population size does:
They’re right, but what is the direction of the connect: same or opposite? I have students discuss this in pairs before voting. When some students are confused, I give an example: If I bring in a cake and share it with this class, will you get more cake when everyone is here, or when some people are off school?
Recognising a feedback loop
With this addition, a loop appears. To see what the loop says, I have students place their fingers on the model and follow the loop around step by step:
- What does a rise in birth rate cause? (rise in population size)
- What does a rise in population size cause? (less available nutrients)
- What does a decrease in available nutrients cause? (lower birth rate)
So, a rise in birth rate ultimately comes back round to cause itself to be lowered again. That’s a negative feedback loop, driving stability in the population size.
Factors affecting deaths
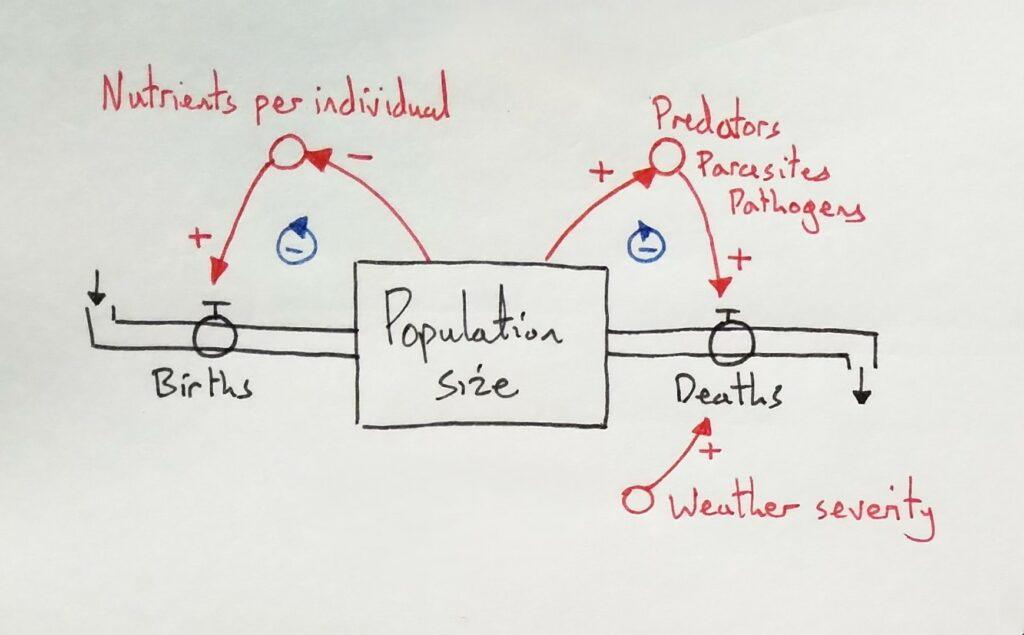
I then repeat the process with the factors affecting the deaths, beginning with predators, pathogens, and parasites.
But here, there’s another distinction.
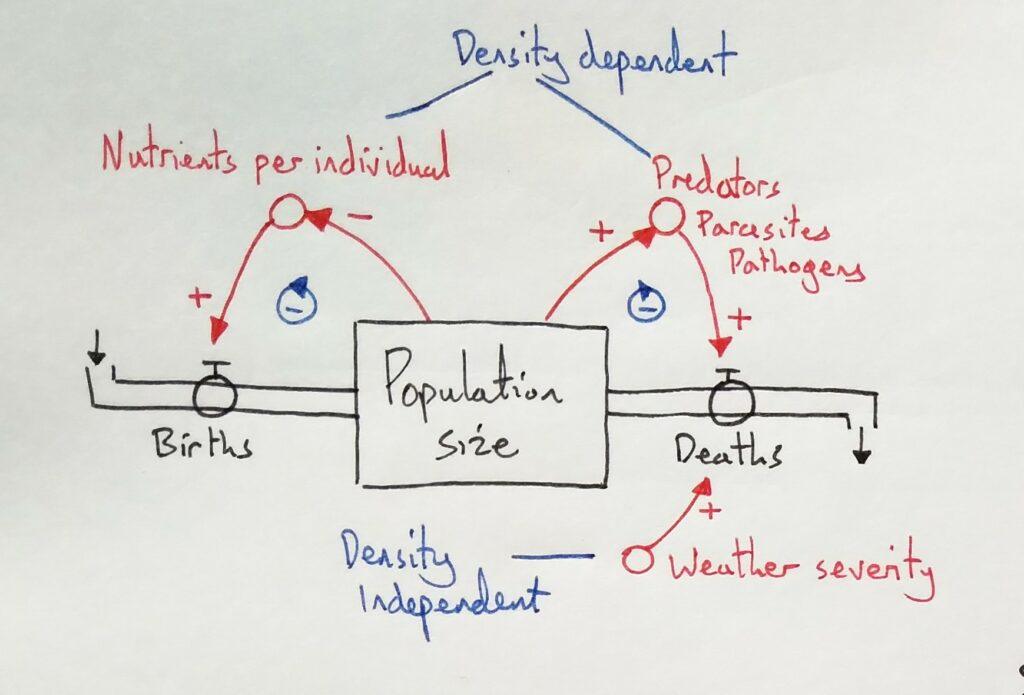
I ask students what affects the weather extremity. They realise that nothing in the model does. I ask, does a rise in population size cause more or less extreme weather? So, then, I ask, what’s the difference between the factors at the top of the model and “weather extremity”? Students typically say something like “the weather doesn’t depend on the population, but the others do”. In other words, two are feedback loops and the other isn’t. And here I suggest the labels of density dependent and independent.
Possible additions to the model
Depending on your students and curricular needs, you could easily expand this model. For example, available nutrients could be connected to deaths with an “opposite” relationship. This helps include famines into the model (such as seasonal scarcities of food).
You could also connect the stock directly to the flows. A larger population will see more births, as well as deaths, just because there are more individuals. This connection is helpful if students suggest that natural disasters and extreme weather can decrease the birth rate (if deaths increase, and the population falls, there will be fewer births).
Making sense of the whole model
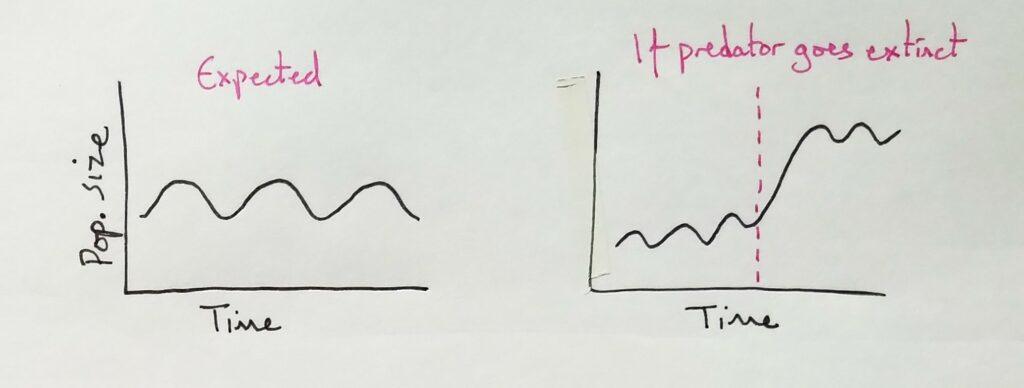
If students are going to understand the model and be able to think with it, they must practice using it. The first question I typically ask is to predict the population size over time on a sketch graph, and another if something in the model changes. Like this:
From here, a number of possible questions are possible, depending on the time you have. Here are some examples I’ve used, which require students to think with the model:
Example questions for exploring
- Private land used for hunting deer often has no predators, while the deer are fed surplus grain. What would happen?
- When a species is endangered, it can be given extra food by humans. What could happen?
If the deer are given surplus food and no predators, they are released from the feedback loops that maintain their size. Their population increases beyond normal, and they browse away all the plants.
But with the endangered species, something interesting can happen. If a small population is “helped” with some extra nutrients, their population size may get large enough that the negative feedback loop causes it to plummet once more; something the conservation effort was supposed to avoid.
Applying the model to us
For the final part of my lessons, I like to turn the model on to ourselves. I draw a sketch graph of our population:
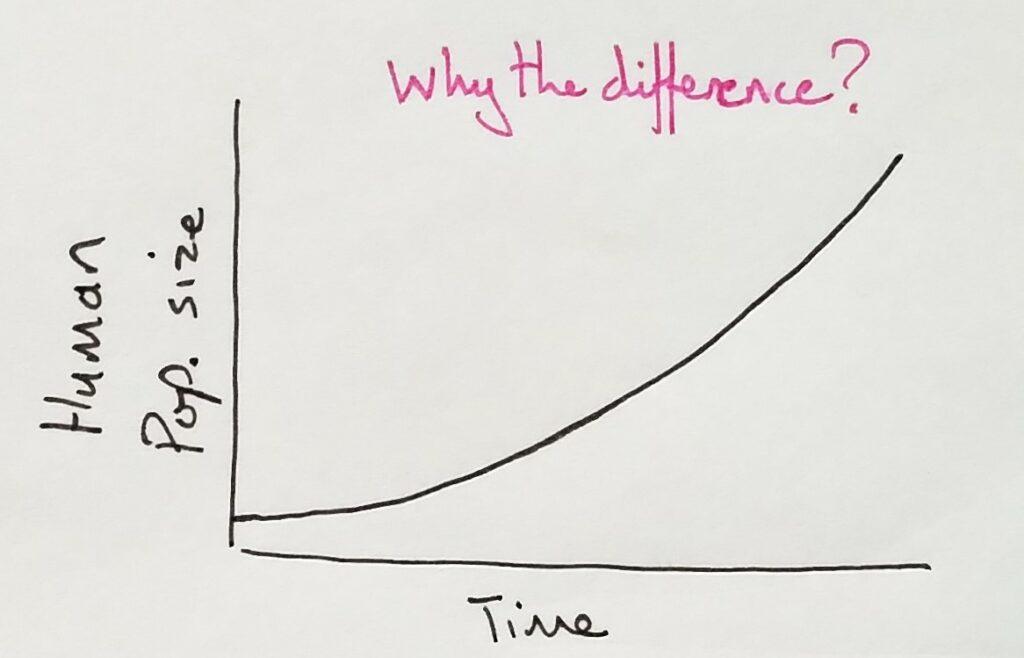
Why does the human population not oscillate but continue to rise? Students are quick to see how medicine, vaccines, and the extinction of large mammals have released us from that negative feedback loop. At the same time, ever more intense fishing practices and fertiliser use have also released us from the other feedback loop.
But can it continue forever, or will our population be controlled again by those negative feedback loops? Will we run out of fertiliser, destroy our soils, and remove vital biodiversity?
This is a great opportunity to explore the paradox discussed by Gregory Bateson, that the more we try to control nature, the less we can (Chaney 2018). Learn more about teaching this way in my books:
References
Chaney, A. 2018. Runaway: Gregory Bateson, the Double Bind, and the Rise of Ecological Consciousness. The University of North Carolina Press.