How I introduce stock and flow models
When I first saw stock and flow diagrams, I knew they were immensely useful in the biology classroom. Yet, it took a few years of trial and error until I found a powerful way to teach with them. I wrote all about that method in Difference Maker. Here I’ll show you how I introduce them to my students.
There are many benefits to these models, here are the first three:
- Simple: Once you’ve learnt a handful of symbols, we can share our ideas more clearly with students and other teachers.
- Familiar Symbols: names and structures change over topics, but the symbols of stock and flow models remain the same; students see what’s happening beneath the technical vocabulary.
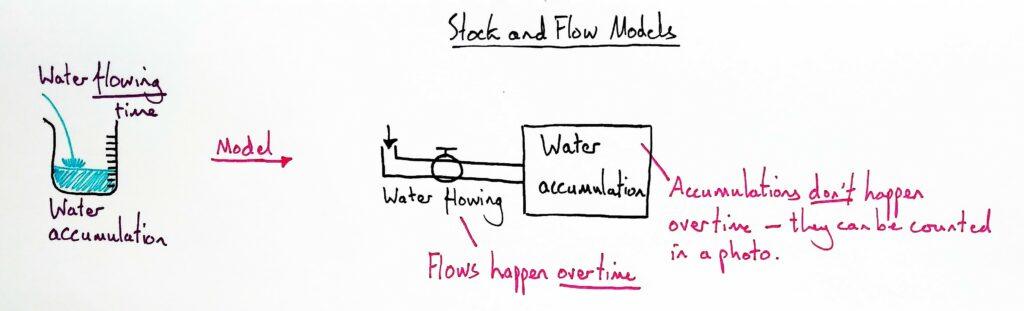
Stock and flow models have symbols based on something we’re all familiar with: flowing water.
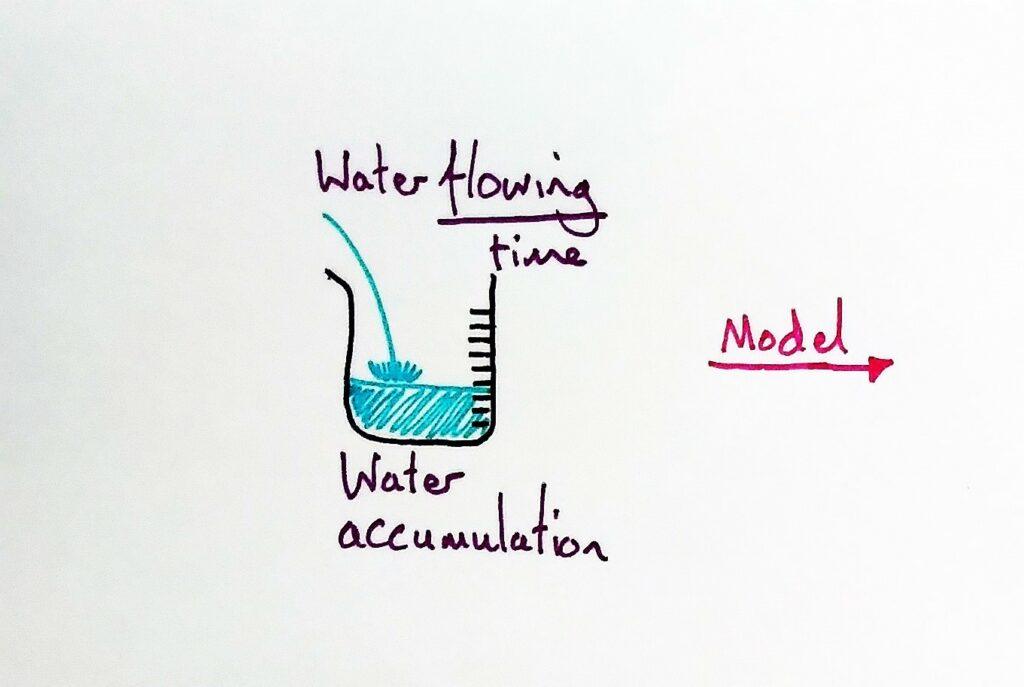
I begin by pouring water into a beaker and asking a student to take a photo. I then ask two questions about the photo. Can we tell how much water is in the beaker? Yes. Can we tell how much water is flowing? No.
This distinguishes between stocks and flows. “What’s the difference?” I ask my students.
- Stocks are accumulations of stuff. You can count them “right now” (not over time) and have units like ml.
- Flows of stuff, in contrast, are happening over time. They have units like ml/seconds.
I tell the students that I’m going to represent the beaker and water in a model and draw it as shown below. Whenever I draw, adding something to our diagrams, I have my students draw with me. This keeps them focused and gives them a model to trace their fingers over when formulating explanations.
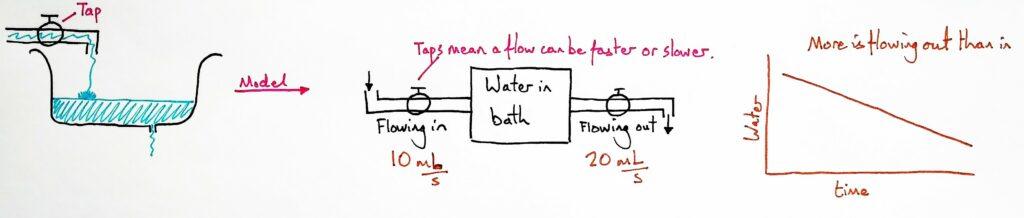
The flow has a tap, the students always ask what it means. It symbolises that the flow rate can increase or decrease. Just like when we turn a tap in our bathtub. That’s what I draw next:
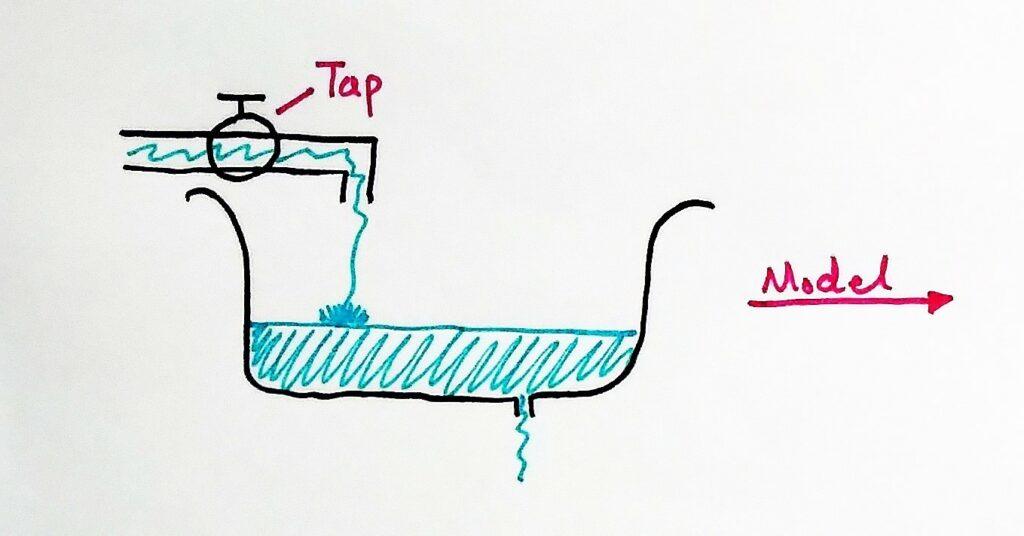
Then I ask the students to draw the bathtub as a stock and flow model. I don’t help them, I want them to make sense of the symbols from the previous model and use them again for the bathtub.
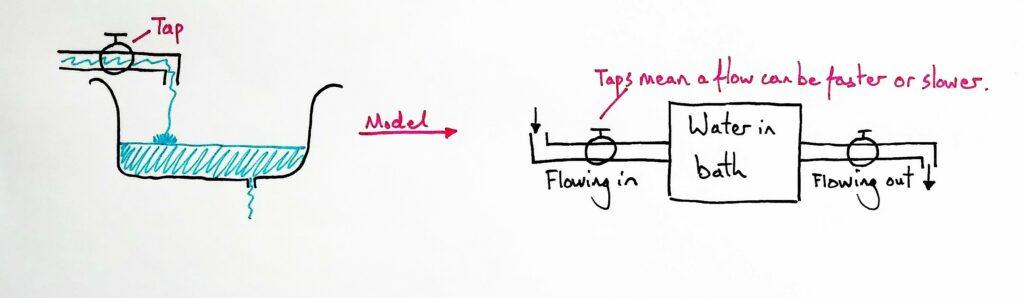
After a few minutes of watching what they do, I show them mine:
Understanding flows
- Name flows with words ending in -ing. This keeps the distinction clear to students.
- Remember that whatever is in a stock (in this case, water) must flow through its adjoining flows (so water again).
Now I focus on the taps. I ask students if the model makes sense (always a good question): Can we change how fast the water flows into a bath? Yes, obviously.
But can we change how fast water flows out of the bath? Yes, the students say. We can put our hands over the hole and, for example, spread our fingers more or less. This is symbolised by the tap, even though we don’t have taps on bathtub drains.
The crucial move
Students will be empowered by remembering the following distinction. So I ask them, what happens when:
- Water flows in faster than it flows out (the bathtub fills up)
- Water flows in as fast as it flows out (the bathtub stays the same)
- Water flows out faster than it flows in (the bathtub drains)
This is an essential move, one that, if habitually applied to stock and flow models, unlocks key understandings. So I ask students these questions one by one and have them vote on the three options.
Some students see it immediately, but others need more help. If I have a sink handy, then we try it out. Another option is to use John Darkow’s bathtub simulation.
Next, I want them to think more about the idea. So I put some numbers on the flows and ask students to sketch a line on a graph:
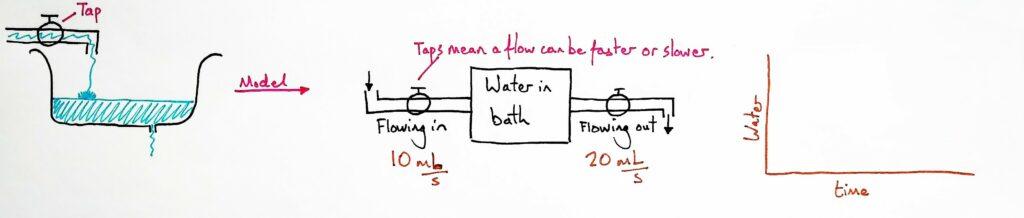
I wander the room looking at my students’ predictions (in pencil) and decide what to do depending on what I see. Eventually, I show my line:
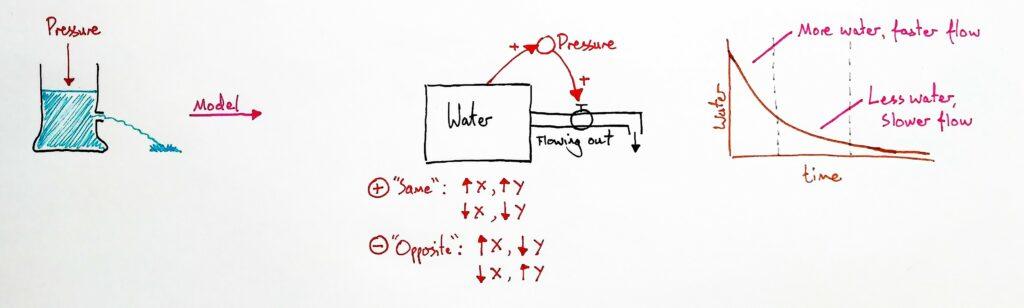
It’s time for the final part of the lesson. I introduce them to a tower of water with outlets. While I prefer to show this physically, I’ve also done it successfully through drawing alone.
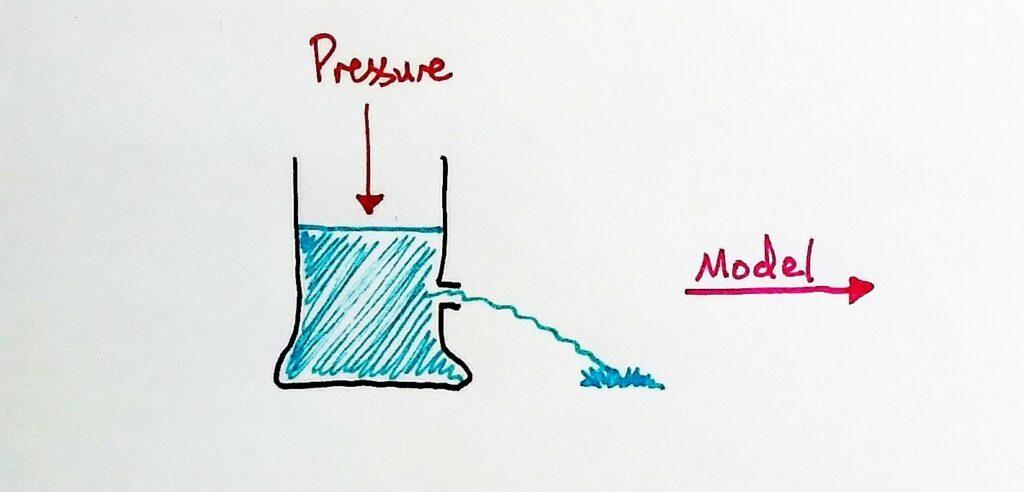
I put my finger over the outlet and ask students what will happen to the flow when I let go. The answer, of course, is that the flow will begin fast, but quickly slow down. So, how could we represent that in a model?
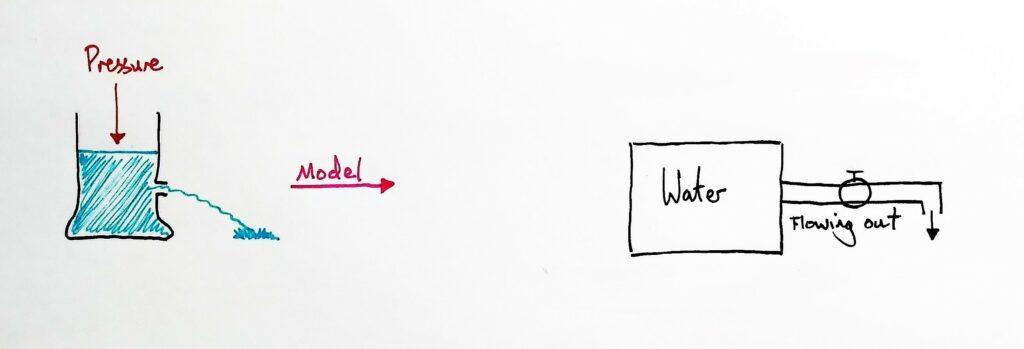
I ask them to draw the tower and water as a stock and flow diagram. I wander to observe their attempts, deciding what to do next, and eventually show them mine.
To represent the change in flow rate, we need to add a cause to the model, something pointing to that tap. When asking the students, they agree that it should be something to do with pressure. But, I ask, what causes the pressure? With more water, there is more pressure, and the faster the flow rate is. We could show it like this:
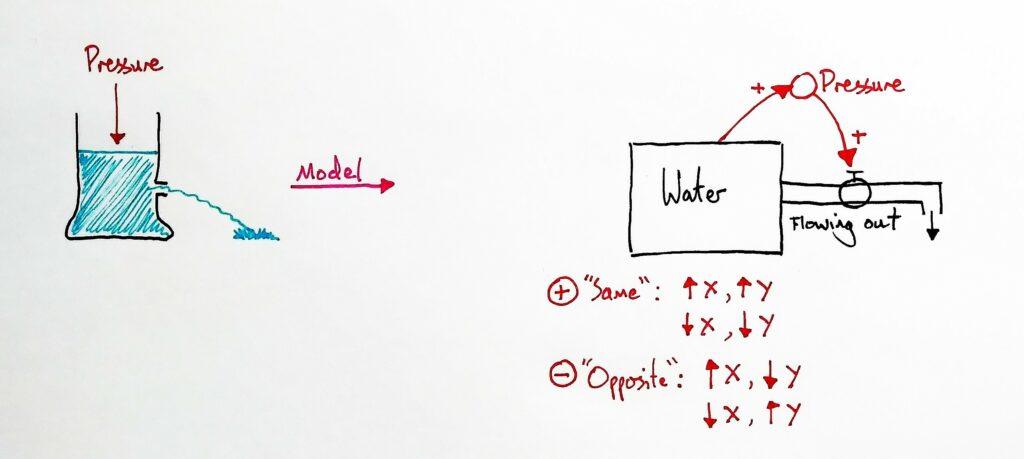
Our final symbols are introduced here: the positive and the negative. You’ll be familiar with their meaning when discussing correlations. A positive correlation means ↑X ↑Y, or ↓X ↓Y. They change in the same direction. Therefore, I refer to positive as “same”.
A positive correlation means ↑X ↓Y, or ↓X ↑Y. The change in opposite directions. Therefore, I refer to negative as “opposite”. We draw this below the model, I ask the students what symbols should be placed on the arrows.
I let them discuss in pairs, and then we vote. I point to the arrow between the stock and “pressure”, and the students vote by raising their hands for “same” or “opposite”. This way, I can quickly see if the class has understood at the same time as having students make sense of the model. I then do the same for the next arrow, between “pressure” and the flow.
It’s time to put fingers on the model and follow its dynamics. We start with the stock and chant:
More water in the tower causes more pressure. More pressure causes a faster flow. More flow causes less water in the tower. Less water in the tower causes less pressure. Less pressure causes less flow…
The model makes sense! It matches what we experience. Now I ask them to represent it on a graph. They make predictions in pencil before I show them my line.
At the beginning, I mentioned two benefits: simplicity (few symbols) and familiarity (the symbols can be applied to any topic). Here’s a third: Sense-making. Rather than explanations students must memorise, these models are tools for formulating many predictions and explanations: students can think with them to make sense of their world.
Notice how, from the model above, we could formulate many explanations. Explanations for when there’s more water and when there’s less water. Stock and flow models are a tool for turning lessons into rich conversations about predictions and explanations. See how I’ve taught other lessons with models in my posts here.
Beware, teaching one or two lessons with stock and flow models isn’t likely to be fruitful. Many students won’t understand the symbols well, and they’ll complain that they don’t like them. Instead, drawing causal diagrams must be a way of doing biology; something done often. Just like how using mathematical formulae is a way of doing physics, students may complain, but they are learning how to be physicists. Learn more about this powerful pedagogy for biology in Difference Maker. And about teaching generally as bringing forth a way of doing a subject in Teaching Meaning.