How I teach blood glucose homeostasis
Blood glucose homeostasis is a classic concept for teaching about feedback loops that drive stability. But, like all of biology, there are so many new structures and technical terms students may not see the wood for the trees. In this lesson, I’ll show you how I’ve taught it to 14-year olds so that they “see the system” among the parts. I do this with a stock and flow diagram, and the method I explain in Difference Maker.
See the video of how I presented this lesson at the International Pre-College Systems Thinking Symposium.
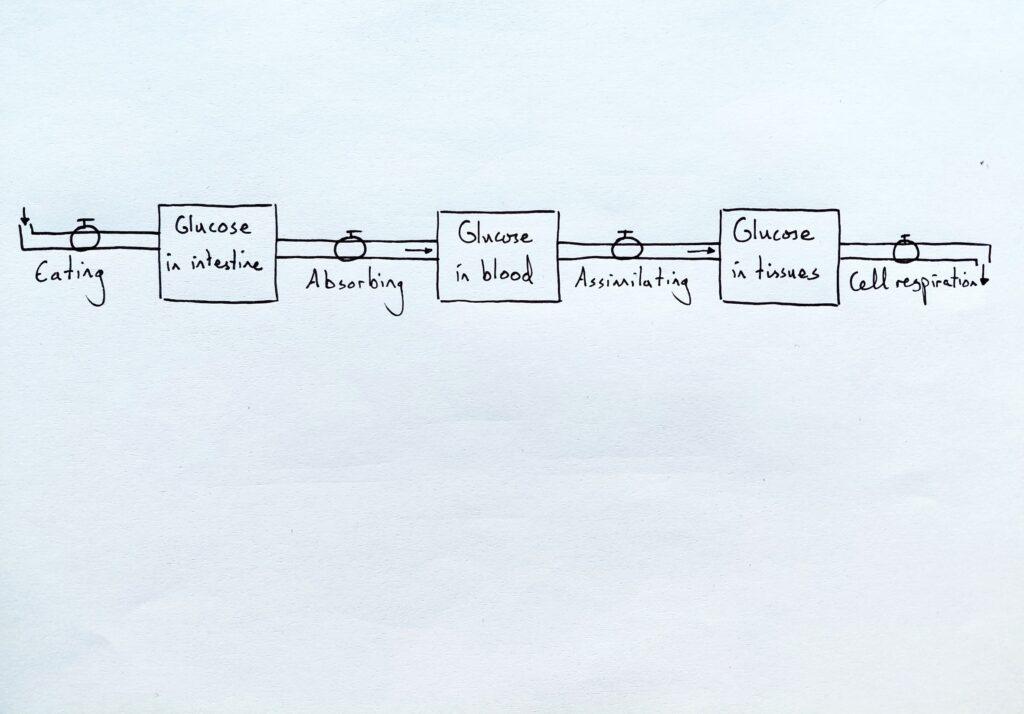
I begin by drawing a simple model and ask students to name the flows in pairs.
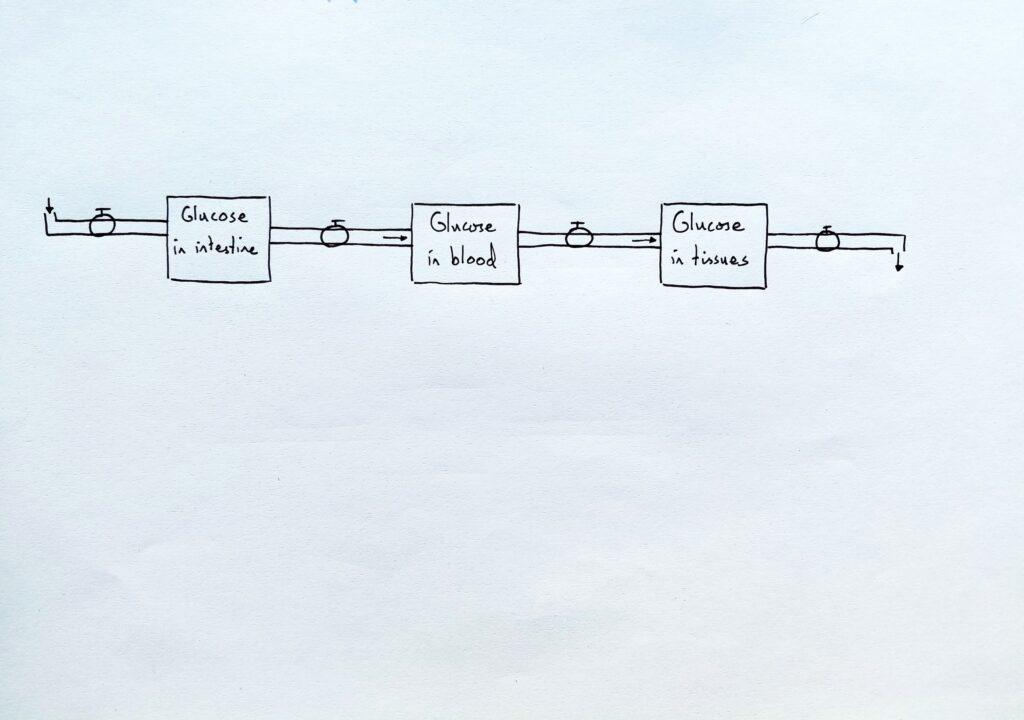
After a minute or so, I ask students what names they’d thought of. When a student offers an idea, I might ask the class to vote (by raising hands) whether they agree or not. This helps me gauge how well students understand the model. Typically, we come to flows with these names:
For the next step, I give a rule to follow: With hyperglycemia, damage occurs to blood vessels and with hypocglycemia, energy availability is too low. Organisms must seek normoglycemia, not too much glucose, not too little. Then, I prompt them to think with the model:
Using the model, what difference would it make if one animal ate continuously throughout the day, and one ate large meals with long fasts in between?
To have students think with models, it’s always good to ask questions about a difference, and what different it makes.
After discussion in pairs, I ask students again what ideas they had come to. There’s always at least one student who realises that only the continuous eater could maintain normoglycemia.
So, I ask them, should we all just eat continuously all day, as the model suggests? What about all the animals that eat sparingly but copiously? Horses may eat all day, but lions may eat just once a day. A large crocodile, maybe once a few months. So, what’s missing from the model?
I let the students discuss some more, and they realise that the problem can be solved with a store of glucose. And I draw this on the model (see the pros of teaching without PowerPoint).
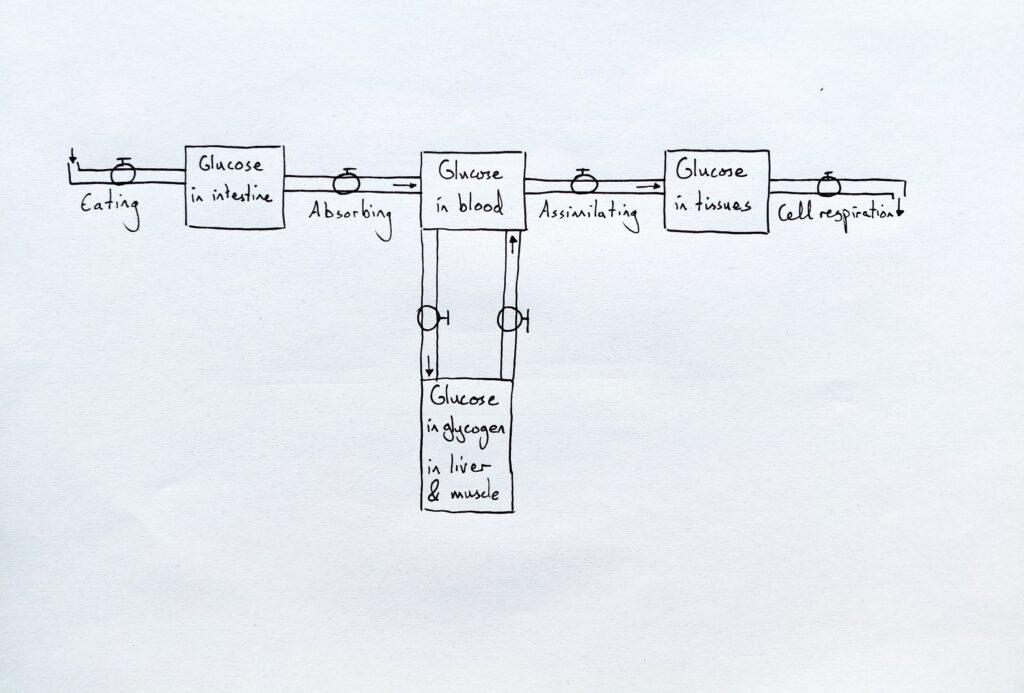
The students have now seen the system, but they need to know how it works.
This requires teaching the technical components they won’t know. Therefore, I add another diagram that shows the biological parts and explain them:
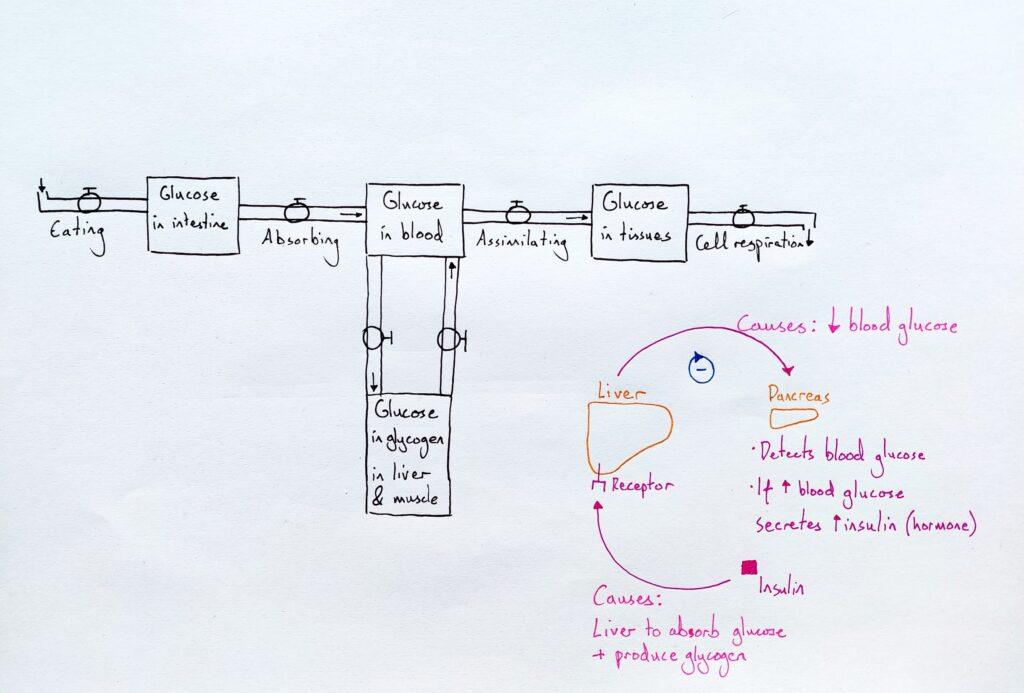
By following the causes, we see that it’s a loop. I ask the students if they can add this to the stock and flow model. They do this in pencil, and I walk around watching what they do. This has students think with the model, making it their own, but it will be difficult for students with little experience with them.
The arrows show that blood glucose affects insulin secretion, which affects glucose storage. But how do they affect them? Students often use the word “affect” without specifying the how, or the “direction”: do they increase or decrease them? I use them terms “same” and “opposite”:
“Same” ⊕ means: ↑X, ↑Y; or ↓X, ↓Y, (so more blood glucose → more insulin)
“Opposite” ⊝ means: ↑X, ↓Y; or ↓X, ↑Y, (so more blood glucose → less insulin)
I have the students vote by raising their hands for “same” or “opposite”. This way, students must make decisions about the meaning of the model, and I get to see how the class understands the model. If there are problems, I can deal with them before moving on. We agree on this:
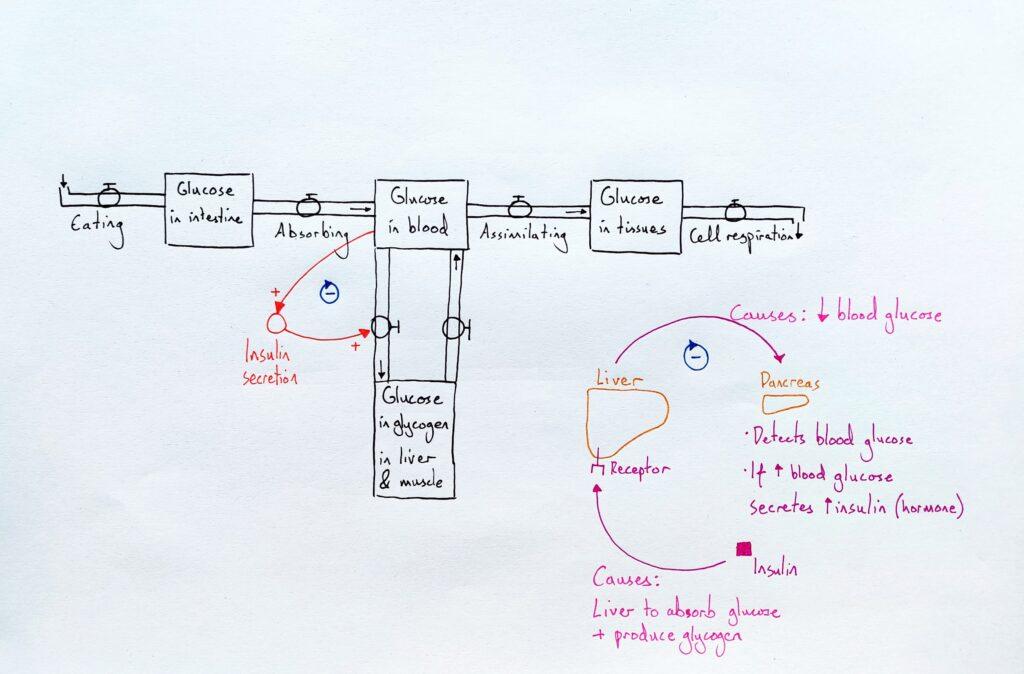
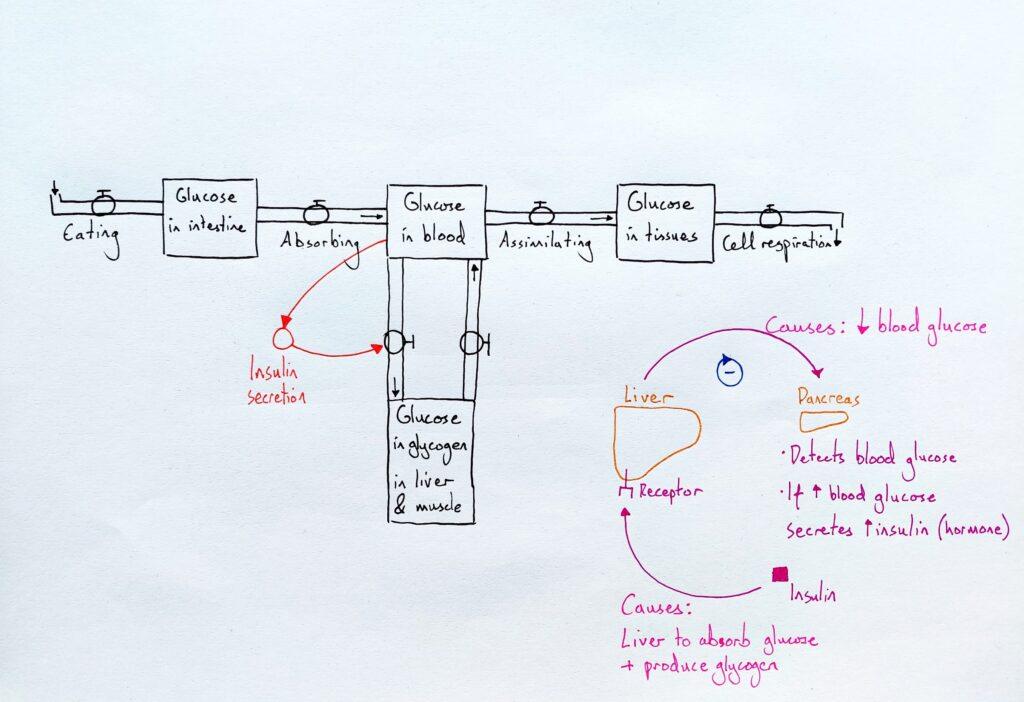
Now there’s a loop to discuss. As a class, we place our fingers on the model and trace it around to decide whether it’s a negative or positive feedback loop:
Glucose in the blood →⊕ Insulin secretion →⊕ Glucose stored from the blood
In words:
- High blood glucose causes high insulin secretion.
- High insulin secretion causes high glucose storage, and
- High glucose storage causes lower blood glucose.
So, high blood glucose ultimately causes lower blood glucose: a negative feedback loop.
Remember, by building a model with “same” and “opposite” connections, these explanations also work the other way:
- Low blood glucose causes low insulin secretion.
- Low insulin secretion causes low glucose storage, and
- Low glucose storage maintains some glucose in the blood.
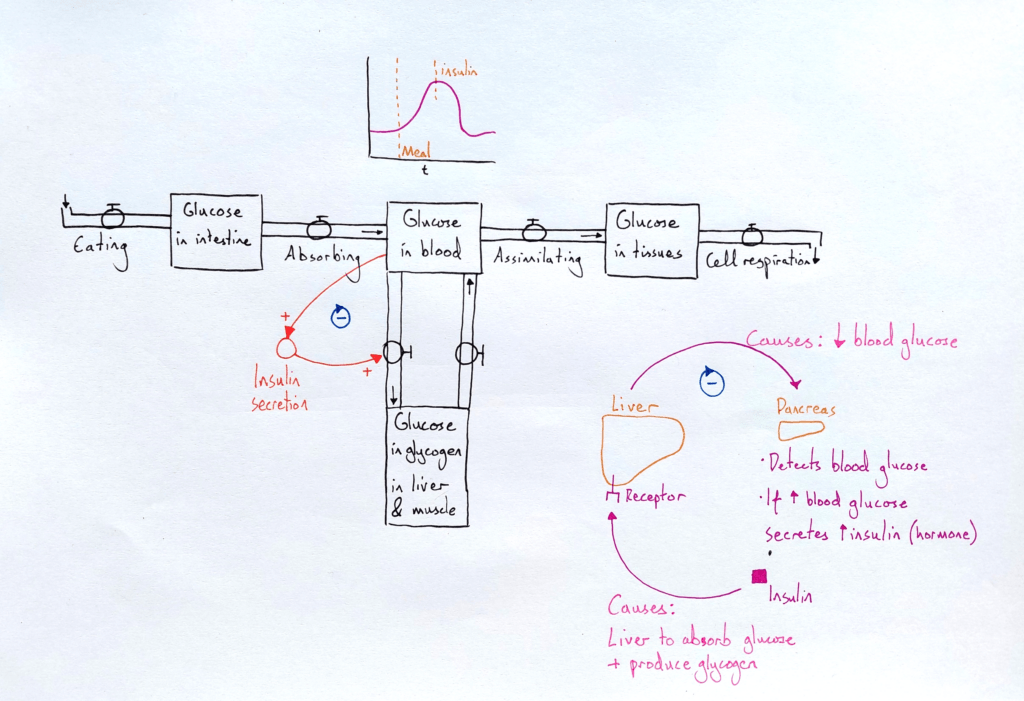
I then ask students to use the model to sketch a graph. Again, in pencil as I wander around to see what they draw.
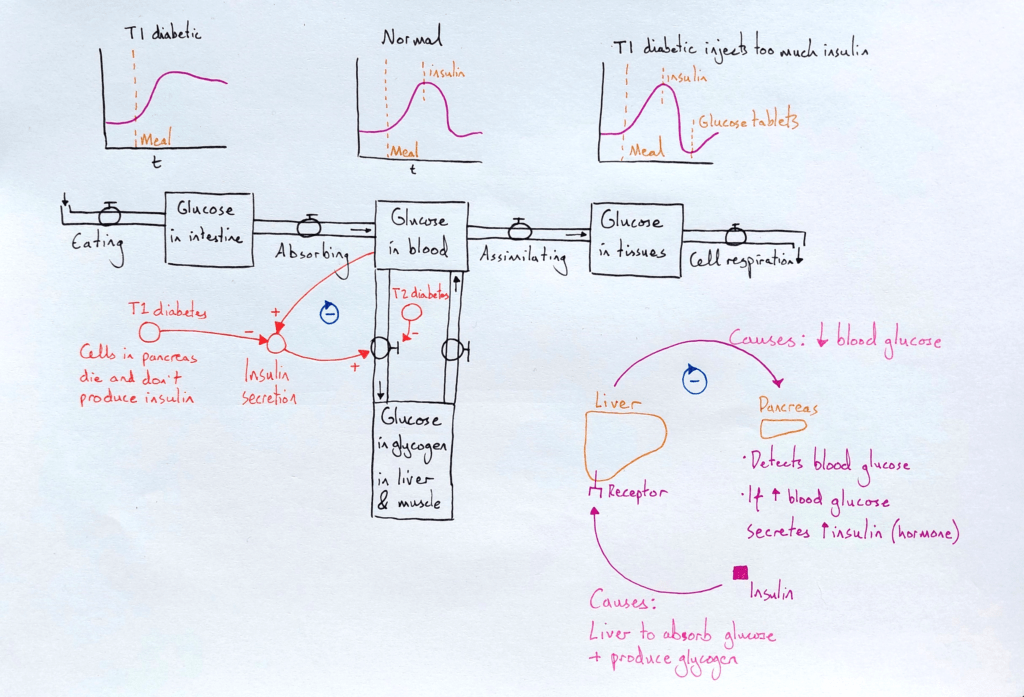
Finally, I discuss diabetes types 1 and 2, their causes, and their consequences. I add these to the model and have students sketch more graphs.
The syllabus I teach to my 14–16-year-olds doesn’t include glucagon. The model still makes sense here by having a “constant, slow but steady” release of glucose into the blood from glycogen stores. In IB biology, for 16–18-year-olds, glucagon is easily added to an extended version of this model, in this way:
- Glucose in the blood →⊝ Glucagon secretion →⊕ Glucose release to the blood
- The lower the blood glucose, the more glucagon is secreted, and the more glucose is released.
If you’ve liked this post and want to learn more, see my books by clicking the covers below. Don’t forget to see my conference presentation on this lesson here.